TOKAI(FY2008 to FY2010)
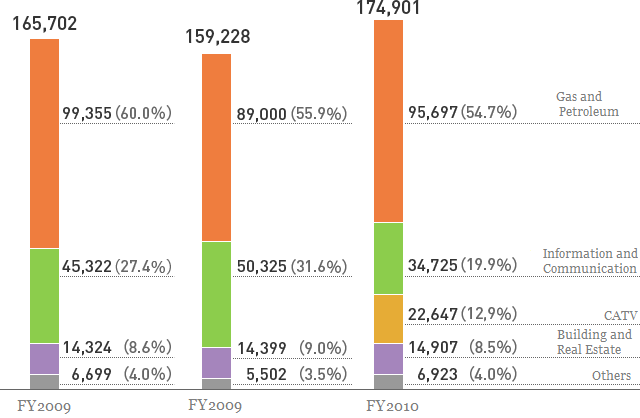
Segment Information
(Millions of Yen)
Balance Sheet
(Millions of Yen)
| Assets | March 31, 2009 | March 31, 2010 | March 31, 2011 |
|---|---|---|---|
| Current Assets | 52,715 | 51,236 | 49,744 |
| Cash and Deposits | 7,405 | 11,084 | 8,622 |
| Notes and Accounts Receivable | 20,653 | 20,298 | 20,321 |
| Securities | 1,011 | 1,183 | - |
| Inventories | - | - | - |
| Merchandise and Finished Goods | 6,715 | 6,719 | 6,823 |
| Work in Process | 2,002 | 1,487 | 1,230 |
| Raw Materials and Supplies | 623 | 679 | 1,515 |
| Deferred Tax Assets | 1,204 | 1,060 | 1,740 |
| Others | 13,500 | 9,201 | 9,930 |
| Allowance for Doubtful Accounts | - 401 | - 478 | - 439 |
| Non-Current Assets | 115,805 | 139,727 | 143,265 |
| Property, Plant and Equipment | 88,356 | 107,778 | 110,613 |
| Buildings and Structures | 35,603 | 49,734 | 50,084 |
| Machinery, Equipment and Vehicles | 26,359 | 25,562 | 24,507 |
| Land | 18,165 | 21,994 | 21,918 |
| Leased assets | 3,554 | 6,713 | 10,093 |
| Construction in Progress | 2,237 | 288 | 367 |
| Others | 2,435 | 3,484 | 11,119 |
| Intangible Assets | 8,795 | 14,810 | 16,654 |
| Investments and Other Assets | 18,653 | 17,138 | 15,996 |
| Investment Securities | 3,822 | 3,932 | 4,395 |
| Long-term Loans Receivable | 1,826 | 1,342 | 541 |
| Deferred Tax Assets | 7,277 | 5,385 | 4,244 |
| Others | 6,543 | 7,274 | 7,608 |
| Allowance for Doubtful Accounts | - 815 | - 796 | - 793 |
| Deferred Assets | 33 | 72 | 229 |
| Total Assets | 168,554 | 191,036 | 193,239 |
(Millions of Yen)
| Liabilities | March 31, 2009 | March 31, 2010 | March 31, 2011 |
|---|---|---|---|
| Current Liabilities | 98,308 | 96,682 | 89,783 |
| Notes and Accounts Payable - Trade | 11,743 | 11,193 | 12,652 |
| Short-term Loans Payable | 59,522 | 61,343 | 53,076 |
| Current Portion of Bonds | 7,070 | 5,324 | 3,680 |
| Lease Obligations | 836 | 1,521 | 2,349 |
| Income Taxes Payable | 1,988 | 1,806 | 1,367 |
| Provision for Bonuses | 1,116 | 1,276 | 1,250 |
| Provision for Conversion of Heating Value of Supplied Gas | - | - | - |
| Other Provision | 11 | 14 | 154 |
| Others | 16,019 | 14,201 | 15,251 |
| Non-current Liabilities | 53,513 | 74,804 | 89,783 |
| Bonds Payable | 4,504 | 3,680 | 11,700 |
| Long-term Loans Payable | 41,512 | 57,339 | 53,700 |
| Lease Obligations | 3,161 | 6,535 | - |
| Provision for Directors' Retirement Benefits | 1,284 | 1,370 | 9,433 |
| Provision for Retirement Benefits | 689 | 935 | 880 |
| Other Provision | 63 | 18 | 26 |
| Others | 2,297 | 4,924 | 5,117 |
| Total Liabilities | 151,822 | 171,487 | 171,650 |
(Millions of Yen)
| Net Assets | March 31, 2009 | March 31, 2010 | March 31, 2011 |
|---|---|---|---|
| Shareholders' Equity | 11,604 | 13,851 | 15,425 |
| Capital Stock | 14,004 | 14,004 | 14,004 |
| Capital Surplus | 8,511 | 4,786 | 2,207 |
| Retained Earnings | - 8,477 | - 2,239 | - 651 |
| Treasury Shares | - 2,434 | - 2,700 | - 135 |
| Valuation and Translation Adjustments | - 364 | - 51 | - 547 |
| Valuation Difference on Available-for-sale Securities | - 364 | - 51 | - 573 |
| Deferred Gains or Losses on Hedges | - | - | 25 |
| Subscription Rights to Shares | - | 112 | 278 |
| Minority Interests | 5,492 | 5,637 | 6,432 |
| Total Net Assets | 16,732 | 19,549 | 21,589 |
| Total Liabilities and Net Assets | 168,554 | 191,036 | 193,239 |
Statement of Income
(Millions of Yen)
| March 31, 2009 | March 31, 2010 | March 31, 2011 | |
|---|---|---|---|
| Sales | 165,702 | 159,228 | 174,901 |
| Cost of Sales | 106,892 | 95,880 | 107,455 |
| Gross Profit | 58,809 | 63,347 | 67,445 |
| Selling, General and Administrative Expenses | 50,529 | 53,317 | 56,690 |
| Operating Income | 8,279 | 10,029 | 10,755 |
| Non-Operating Income | 1,885 | 3,266 | 973 |
| Non-Operating Expenses | 10,422 | 2,472 | 2,240 |
| Ordinary Income | - 257 | 10,822 | 9,489 |
| Extraordinary Income | 1,070 | 130 | 265 |
| Extraordinary Losses | 1,878 | 2,317 | 3,533 |
| Income Before Income Taxes and Minority Interests | - 1,065 | 8,635 | 6,221 |
| Income Taxes - Current | 2,406 | 2,663 | 2,581 |
| Income taxes - deferred | - 2,263 | 1,882 | 434 |
| Minority Interests in Income | 977 | 1,008 | 1,054 |
| Net Income | - 2,187 | 3,080 | 2,152 |
Cash Flow Statement
(Millions of Yen)
| March 31, 2009 | March 31, 2010 | March 31, 2011 | |
|---|---|---|---|
| Cash Flows from Operating Activities | 22,406 | 21,915 | 23,521 |
| Cash Flows from Investing Activities | - 20,064 | - 25,665 | - 14,601 |
| Cash Flows from Financing Activities | - 2,787 | 7,253 | - 11,278 |
| Effect of Exchange Rate Change on Cash and Cash Equivalents | - 23 | - | - |
| Net Increase (Decrease) in Cash and Cash Equivalents | - 468 | 3,502 | - 2,359 |
| Cash and Cash Equivalents at Beginning of Period | 7,467 | 6,998 | 10,501 |
| Cash and Cash Equivalents at End of Period | 6,998 | 10,501 | 8,141 |